Dynamometer software working with roller chassis dynamometer has a difficult task to complete. It directly measures power that is transferred from the vehicle to the dynamometer, but you or your customer says: I’m not interested in power on wheels. What power does my engine have?
Let’s see where the engine power goes on chassis dynamometer and how the engine power is calculated.
The dynamometer and its controller measures roller speed, roller acceleration and absorber torque. From this information it can precisely calculate power absorbed by Dyno elements inertia and Absorber. The sum of these in Dyno2 software is named “Power on wheels“. If you have done a good job calibrating the load cell and provided accurate dyno connected inertia values, power on wheels will be an accurately measured value.
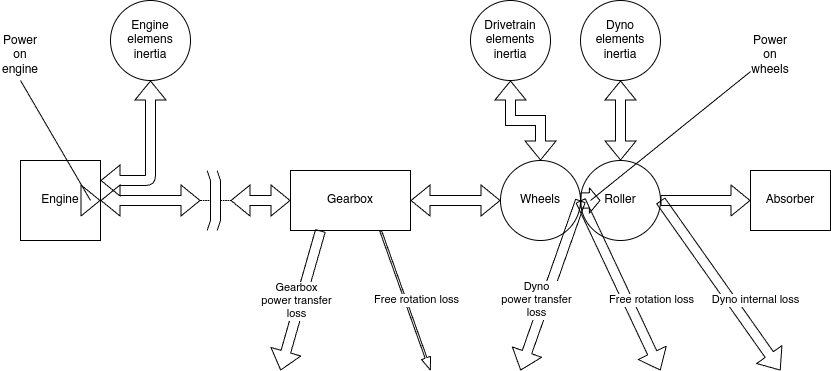
Now the fun part begins, because as you can see on the diagram, there is a long way from “Power on wheels” to “Power on engine” with a lot of stuff going on along the way.
First thing on the way is Free rotation loss. It’s a power that is lost on wheel-roller contact patch and in drivetrain components when the whole assembly is freely rotating. It’s calculated during coast down phase after power measurement, when the whole assembly is decelerating nearly without power transfer.
To calculate it, the software needs information about deceleration rate and about whole assembly inertia. Deceleration is measured and dyno inertia is known. The only thing missing is Drivetrain elements inertia. We have some luck here, because most inertia comes from rotating elements that have the largest diameter. We can get some quite good inertia estimate from vehicle wheel diameter.
The second power loss along the way is a loss from power transfer on wheel-roller patch. We take it from experimental data, and it is around 8% of the transferred power.
Third one is power transfer loss in gearbox. The easiest one is the common manual gearbox or automatized manual gearbox. It looses around 4% of transferred power. The hardest one are hydrokinetic gearboxes. Not only these have much larger range of loss percent (or efficiency) but also the efficiency depends highly on amount of power that is transferred.
The last enemy on the road is Engine elements inertia. In measurements other than steady state, it absorbs part of generated power. It can be roughly estimated from engine displacement. If engine inertia value is correct, engine power measured on different gears should be the same.
Wheel – roller patch similarity to a belt drive
Some questions may arise about our model of wheel – roller power transfer. You may ask: “Why do we need to add a power loss factor of around 8% if we measure the losses on the coastdown?”.
The wheel – roller patch is a power transmission device very similar to a belt drive. Instead of a steel pulley and rubber belt, it has a steel roller and a rubber tire. It’s an established engineering knowledge that when a transmission device works in an optimal power range (the power is not too small), the power loss in it is basically a constant number that is a fraction of transferred power (not the speed). Take a look at the belt drive efficiency plot:
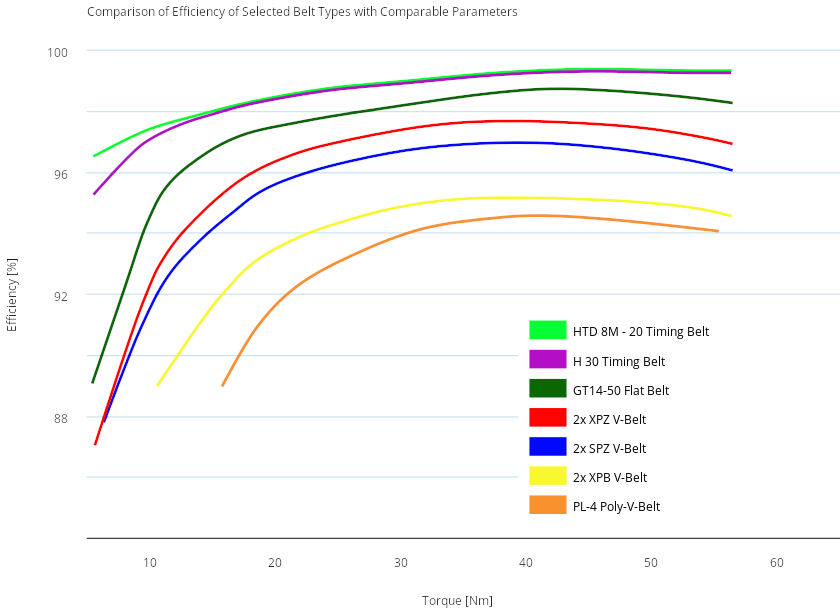
As you can see, if the transferred torque is not too low, the efficiency is nearly a constant number. That efficiency is a number that translates to our ~8% loss factor. There is still an issue of efficiency rolling down when the power transfer is very low for a particular power transfer device. This is compensated with the losses measured at the coastdown. Both compensations used together result in a quite good model of what’s going on that can’t be well replaced with only constant power loss value or only constant power loss fraction. Let’s now see a practical example how this works on the dyno and what is a low power for a power transfer device that is made of a car wheel and dyno roller:
For both examples we consider a single speed point: the power measured at 150km/h speed where our example dyno measures 30HP coastdown losses.
Example 1:
The measured power on wheels is 70HP
We add our 30HP coastdown losses and get our first correction to 100HP
We use our 8% loss factor to get 108HP = 100HP * 108%
The final efficiency of your wheel-roller transmission is 70HP / 108HP = 65%.
The total loss is 108HP – 70HP = 38HP
The coastdown losses (30HP) are in this case more important than the 8HP lost due to power transfer efficiency, and we are definitely near the left side of the efficiency vs power plot.
Example 2:
The measured power on wheels is 670HP
We add our 30HP coastdown losses and get our first correction to 700HP
We use our 8% loss factor to get 756HP = 700HP * 108%
The final efficiency of our wheel-roller transmission is 670HP / 756HP = 89%.
The total loss is 756HP – 670HP = 86HP.
The power transfer losses (56HP) are in this case more important than the 30HP from the coastdown measurement.
I hope that those examples helped you to jump to the same conclusion as me: If you replace our example 30HP and 8% combination with only one higher number:
-HP number: You will get overestimated power for low power engines and underestimated power for powerful ones,
-% number: You will get underestimated power for low power engines and overestimated power for powerful ones.
Last question to answer is how to set up the loss from load factor of the wheel – roller transmission? Unfortunately, you can’t easily measure it on the dyno like the free coastdown losses. The best way is to make sure that you have all the inertia values calibrated correctly, and then adjust the loss factor so your on engine power calculation will match the catalog data or the measurement made on an engine dyno.
What can I do to get most accurate engine power calculation on chassis dyno?
- Use a dyno which has high roller inertia. By maximizing the inertia you know precisely, you can minimize unknown inertia estimation error influence on engine power result.
- Use a dyno with absorber that can support steady state measurement. When the whole vehicle – dyno assembly is rotating at constant speed, power is not transferred to and from inertia.
- Take care to fill all inertia and losses values. If you get them right, calculated engine power will also be right.
How all this looks like in the software?
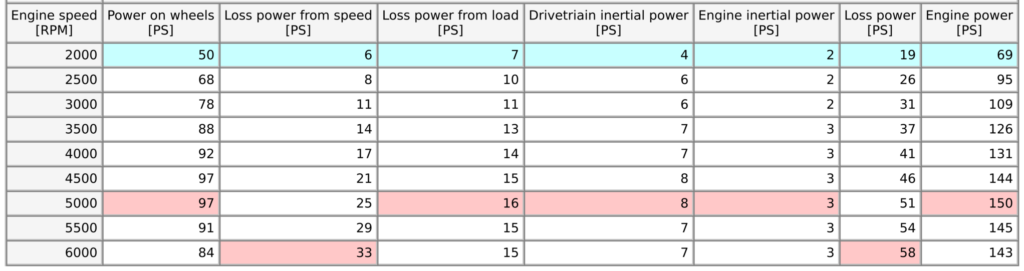
- Power on wheels – power measured by dynamometer
- Loss power from speed – power loss that is measured during coast down phase – free rotation loss
- Loss power from load – power that is lost due to power transfer efficiency – both in drivetrain and on tire-roller patch
- Drivetrain inertial power – power that is being accumulated in drivetrain inertia – mainly vehicle wheels
- Engine inertial power – power that is being accumulated in engine inertia – mainly engine flywheel
- Loss power = Loss power from speed + Loss power from load + Drivetrain inertial power + Engine inertial power
- Engine power = Power on wheels + Loss power
Power measurement conventions in the USA – Power on wheels
Since vehicle manufacturers in their specifications state the engine power and engine torque, the goal of all the calculations and corrections in the software is to get that number from the power received by the dyno. Together with use of power correction standards, this allows you to compare your vehicle performance with stock performance declared by the manufacturer and with measurement results from other dynos.
A long time trend in the USA is to look at the power on wheels. “That’s what accelerates my car”, you say. Technically that’s correct. Power on wheels is a way to see improvements in vehicle performance that will translate to better times on a track, when the measurements are made on the same dyno, in the same conditions. While looking at the power on wheels you can see an apparent gain in power that you can get from installing lighter flywheel, driveshaft or rims. Unfortunately that’s where the benefits end. Hera are a few shortcomings of the power on wheels:
- There is no consistency among dyno manufacturers with what corrections should be applied to the power on wheels.
- Is it just raw power received by the dyno?
- Should it be corrected for vehicle components moment of inertia and be a steady state power, or should it be affected by installing lighter flywheel and rims?
- Should the correction standard like SAE J1349 or DIN 70020 be applied, or should it show the real power that it measured on the wheels in the current weather conditions?
- Should the dyno measure coastdown losses and correct the power on wheels reading, or should the losses in gearbox affect the power on wheels?
- What about the loss of power when it’s transferred from tire to the roller? Added to power on wheels or not? What to do when using hub dyno that eliminates tires? Subtract some extra loss to have results comparable with roller dyno and represent the vehicle road performance?
- The measurement results will vary depending on the test conditions.
- Tests on different gears result in different speed losses and vehicle components moment of inertia effect. These changes power on wheels.
- If coastdown loss measurement is not performed, the heating of gearbox oil, differential oil and tires will affect power on wheels. Varying the tension of straps that hold the car will have the same effect.
- If vehicle components moment of inertia is not compensated, then the different acceleration rate will result in different power on wheels reading. You will get different acceleration rates on different gears, on different dynos with heavier or lighter rollers and while varying the load from the absorber in braked dyno.
- The measurement results will vary depending on dyno type. Will you be able to compare results between roller and hub dyno? Not to mention engine dyno.
I know that I won’t change the USA way of life, but I strongly encourage you to work with engine power and engine torque. When all the corrections are properly used, these values are comparable across different dynos, different conditions and with manufacturer specifications. Also within your own dyno, across measurements, the engine power calculation compensates for varying conditions.
Why doesn’t the software show torque on wheels? First you should ask yourself where this torque on wheels that you’re looking for is. If you answer that it is on the wheel axles, you should revise your knowledge about power, torque and rotational speed relation. It’s also not on the engine shaft, since it’s not the engine torque. What you’re probably looking for should be described as “the torque that the engine would have if we assumed that there are no losses in the drivetrain and the engine power is equal to the power on wheels”. That would be power on wheels divided by engine speed. This calculation with using a mix of power from wheels and speed from the engine doesn’t make much sense. Summing up, the software doesn’t show “torque on wheels” that you have in mind, because it doesn’t exist in the real world. You can use engine torque to have a reference of the torque available across the engine speed. Even better, in pair with power on wheels, you can display tractive force which is a real thing.
How to use the software to generate results sheet the USA style? You can skip using the available corrections (inertia, coastdown loss, drivetrain loss, etc.) per your preference.
How to keep the engine power and engine torque as is, and display power on wheels and “torque on wheels” with some corrections, but not the default raw power on wheels? The software has a function module that allows you to create your own channels with equations. You can create equation for power and torque on wheels that is calculated any way you like.
Dyno internal loss
As I explained above, the most useful number the dyno gives you is the engine power / torque. If for some reason you still care about power on wheels, then there is an issue of internal losses in the dyno.
If you have the internal losses set to 0, you can simplify power calculation like this:
Power on wheels = raw reading
Engine power = power on wheels + total free rotation loss (loss model) + some other corrections
In this case free rotation loss (loss model) account for all the losses measured in coastdown. Both that in the dyno and in the vehicle. So the engine power reading is correct, but the wheel power is missing the losses internal to the dyno.
We can set up internal loss model, then the simplified power calculation will be like this:
Power on wheels = raw reading + internal loss model
Engine power = power on wheels + vehicle free rotation loss (loss model) + some other corrections
The engine power reading will still be the same as the usual loss model will only account for the remaining losses in the vehicle. Only if you mess up the internal loss model to give too high losses, you can mess up the engine power reading.
Setting up dyno internal loss
First, it must be stated, that the usual way to measure internal loss is very dangerous. If you die during this process, please don’t complain. You’re doing it at your own risk, and you don’t need to do it for correct engine power / torque readings.
The dyno inertia must be already accurately calibrated.
- You will need to measure coastdown of the dyno rollers the same way you do the in the normal measurement. The few differences are:
- At the top speed you need to detach the vehicle from the dyno. Using a forklift may be the safest way to do this.
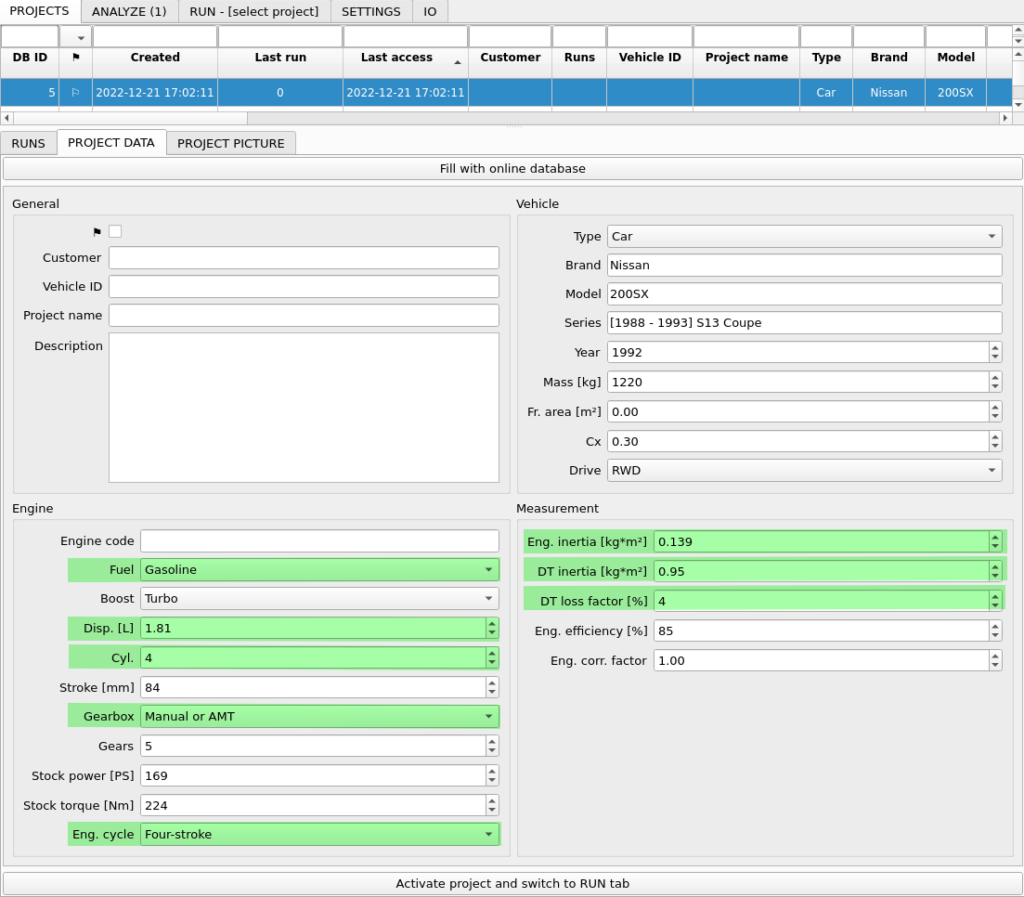
- In PROJECT settings, the DT inertia must be set to 0, since the drivetrain won’t be taking part in the coastdown.
- Full throttle is not needed at the acceleration part of the measurement, since it’s not used in the calculation.
- Load the run to ANALYZE, right-click it and select “Calculate Loss Model”
- Make sure that the coastdown looks reasonable and nothing unusual is happening there.
- Note down the loss model coefficients. There is also a copy function under right-click.
- Now where you use the coefficients depends on your dyno type:
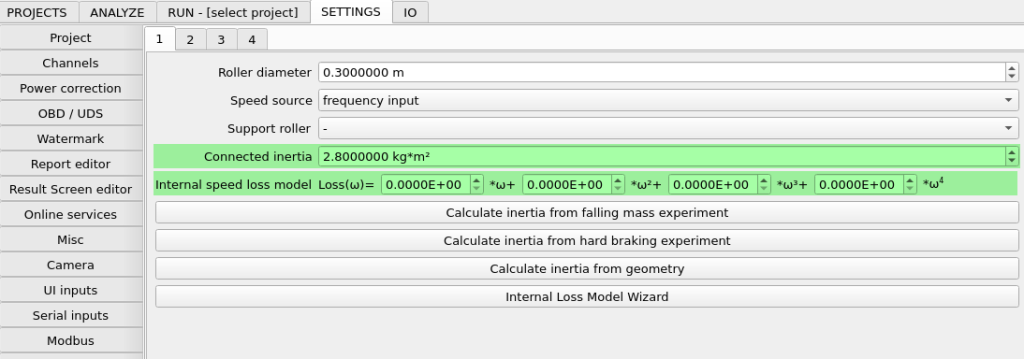
- If the dyno always runs in the same configuration (2WD dyno or permanently linked 4WD), just paste the coefficients to SETTINGS / General / Internal dyno speed loss model
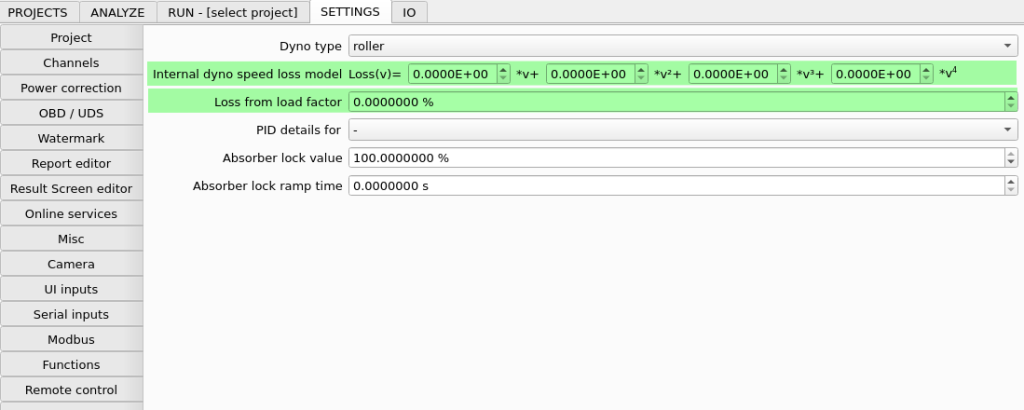
- If the dyno have separate parts that can run or not (not linked 4WD, hub dyno), you need to use the “Internal speed loss model” under SETTINGS / Roller to set up the losses for the separate parts of the dyno. This time don’t paste the coefficients directly, but use Internal Loss Model Wizard to convert the coefficients from road speed based to rotational speed based. The multiplier and divider in the tool are there if you want to account only part of the measured losses to a roller set. Normally leave them set to 1.
Some questions that may arise
Why “Loss power” on your dyno is different from other software? Why are there bumps on “Loss power” in main chart. Why it falls at the end. Shouldn’t it be smooth and rise up to the end?
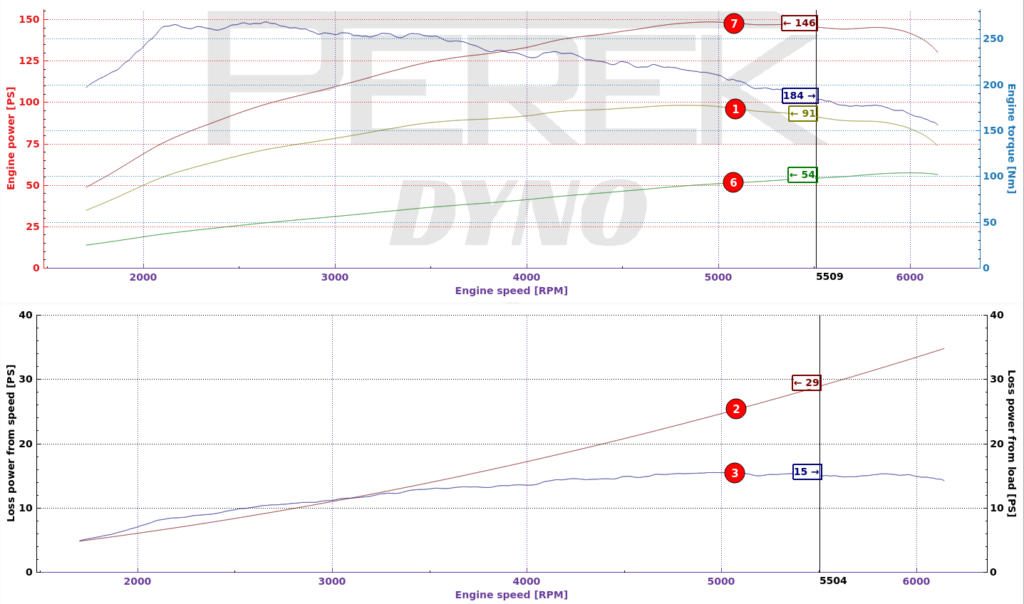
Loss power in main chart is a sum of loss from speed, loss from load, power lost to accelerate drivetrain, power lost to accelerate engine flywheel. Because some of these are a fraction of generated engine power, all fluctuations of engine power will be partly reflected on this curve.
Loss power from speed, that is measured in coast down phase, should be smooth and rise up to the end. You can see this curve in the bottom chart (curve 2).
Other software may show only loss measured during coast down phase and add other losses to “Power on wheels” or “Power on engine”.
Some software will just compensate other losses with higher inertia value in dyno configuration. With this approach, the engine power result will still be correct for typical vehicles, but it may be inaccurate for some configurations.
Why “Loss power” and “Power on wheels” change if I make short inertial only run or long run with absorber and slow acceleration?
Loss power from speed (curve 2) measured during coast down will not change. Total loss power (curve 6) which also contains power used to accelerate engine flywheel and vehicle wheels will. To explain this, let’s calculate a simple example:
Rotational inertia of two typical 60cm car wheels: ~2kg*m²
Kinetic energy accumulated in these two wheels when running at 200km/h: 34kJ
Average power needed to accelerate the wheels in 10 seconds = 34kJ / 10s = 3.4kW
Average power needed to accelerate the wheels in 60 seconds = 34kJ / 60s = 0.6kW
As you can see, during fast inertial only run, vehicle drivetrain inertia consumes more engine power. This power is added to “Loss power” (curve 6) and subtracted from “Power on wheels” (curve 1).
In longer run with absorber, less power (not less energy) goes to accelerate vehicle drivetrain. This power will go to the dyno, and it will increase “Power on wheels” reading.
Of course, these calculated average power values are a big simplification, as the power consumed by wheels rotational inertia is not constant across the run.
This effect is also a reason why inertial dynamometers that don’t take flywheel inertia into account will show higher engine power after change to light flywheel. Of course, with a light flywheel, your car will accelerate faster because during acceleration power available at the wheels will be greater, but the flywheel didn’t change static engine power output.
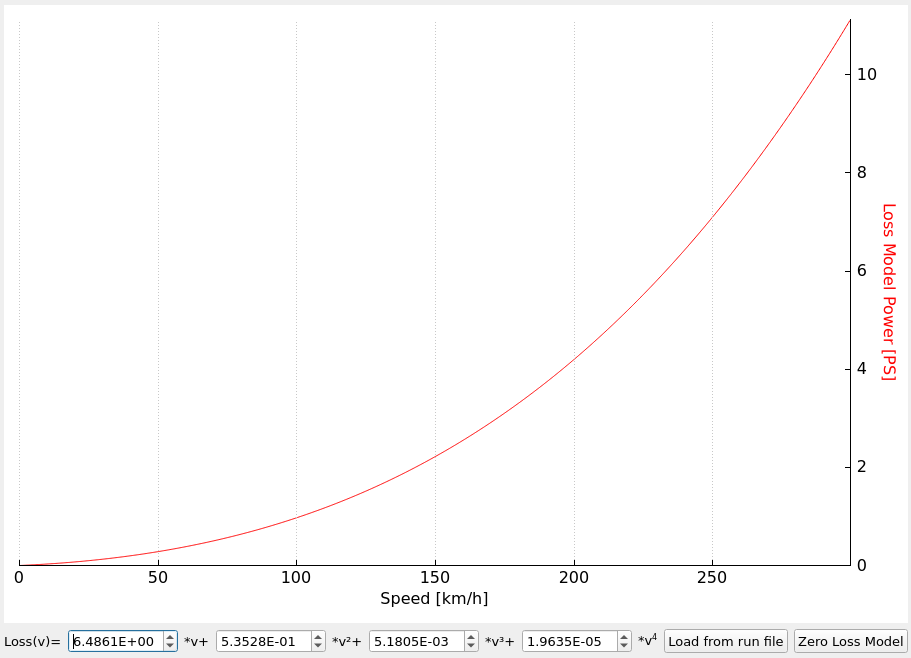
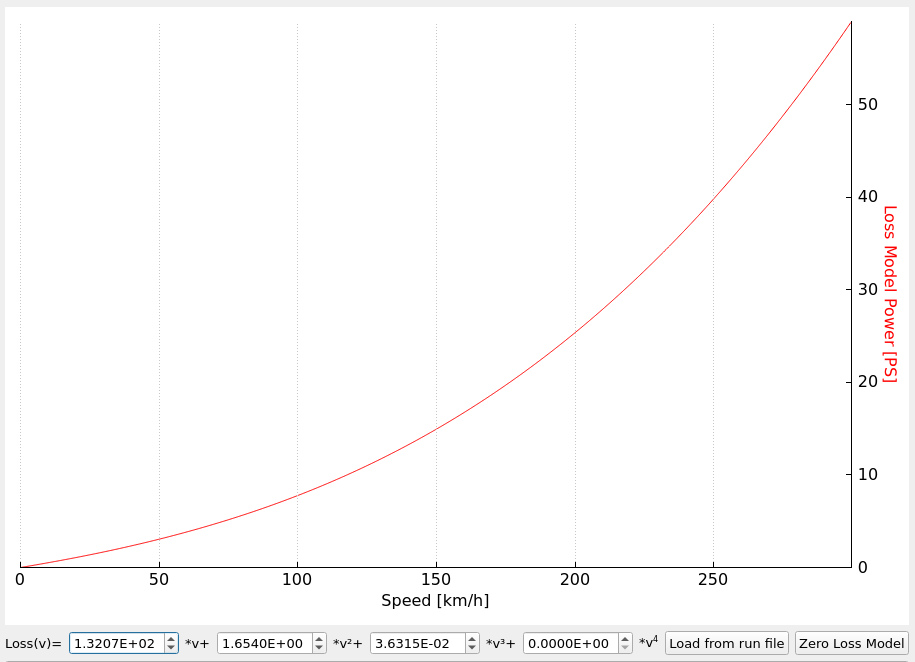
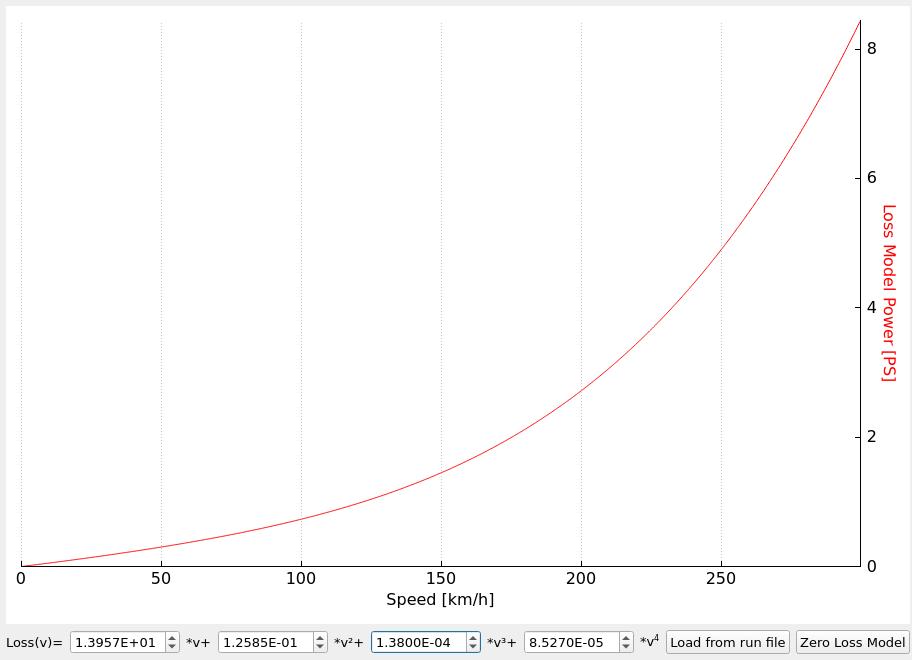
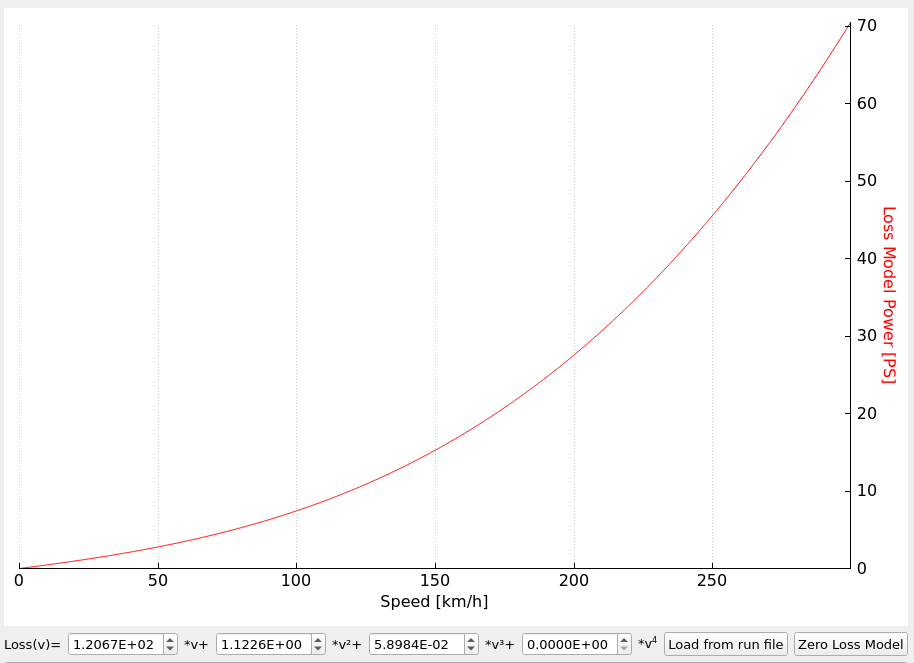
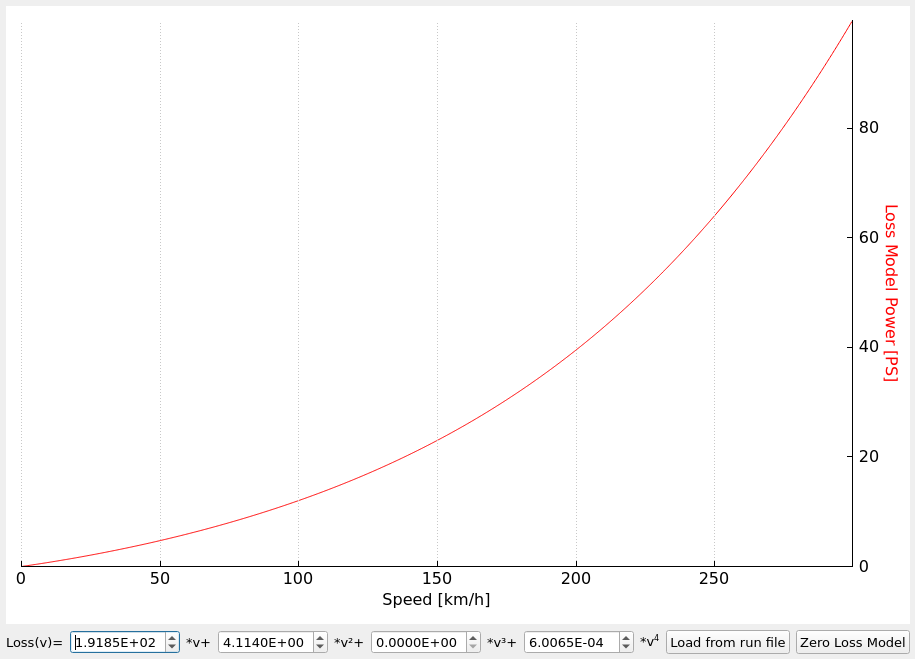
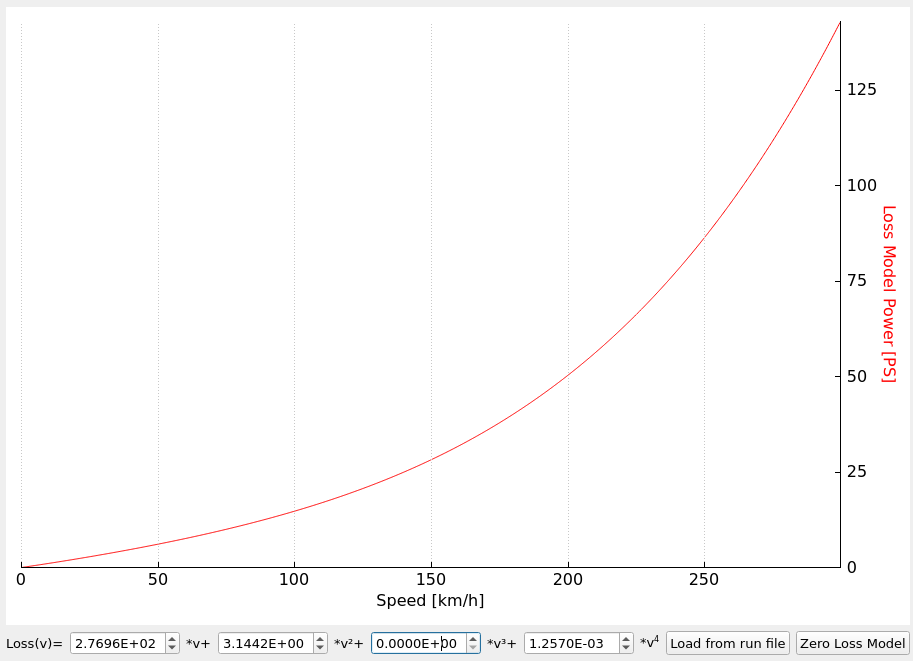
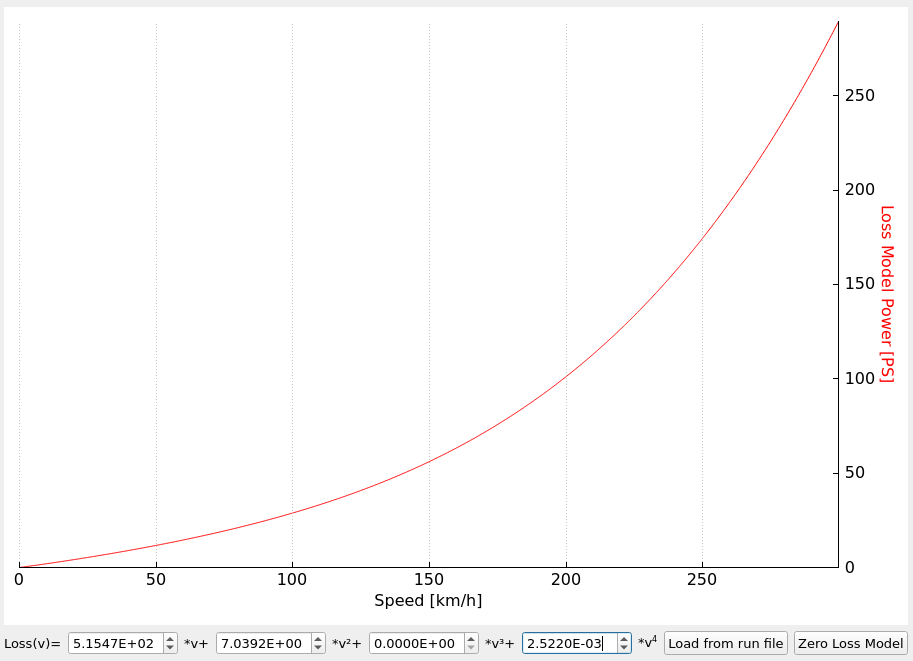
Free rotation loss examples
You often ask if losses in your dyno are not too big. The amount of power that is lost only to spin the dyno and the car can be surprising. Below I present some of the data for reference. Remember that these are only examples. Especially the losses on roller dynos with vehicles can be much different depending on the vehicle weight and tires.