Runs can be loaded to ANALYZE tab by double-clicking them in PROJECTS tab. In the ANALYZE tab you can find a table, that lists loaded runs, and desktop space available to set up widgets for analyzing runs.
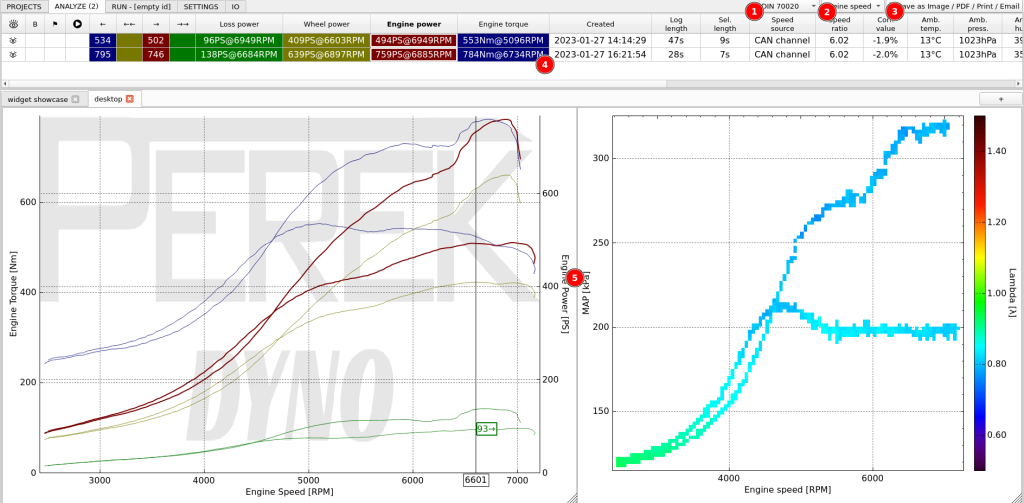
- Correction standard selection
- Master channel selection
- Save / Print / Email button for exporting reports out of the dyno software.
- Run table showing runs loaded in ANALYZE tab
- Desktop area to add and arrange data analysis widgets.
ANALYZE tab widgets
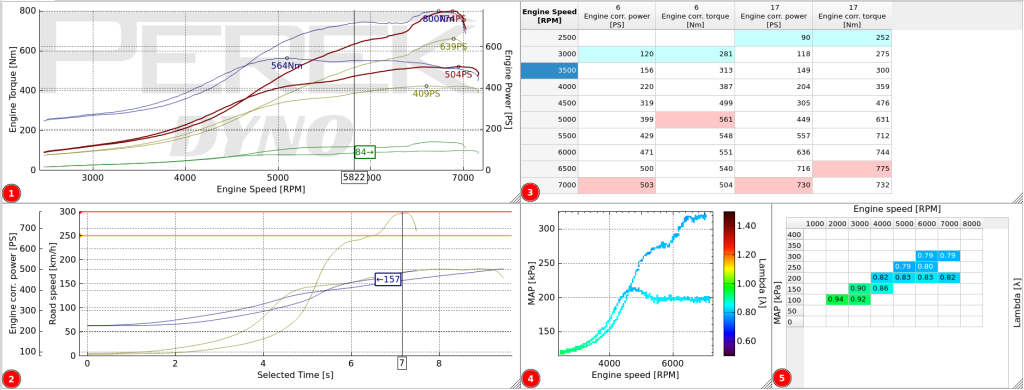
- Main chart – Typical dyno chart that has fixed power and torque channels selected on vertical axis and limited options for x-axis channels. It has special connections with the run table to display Engine Power, Engine Torque, Loss Power and Wheel Power as a function of Engine Speed, Road Speed or Time.
- User chart – chart that has all axis freely selectable. The charts have fully customizable labels, units, colors, background and many more.
- Result table – table that can show multiple channels from multiple runs at once.
- Color map – map that shows a channel as a function of other x and y channels. Good for visualizing map data in high resolution.
- XY table – table that shows average channel values in predefined x, y channel bins. The bins are fully definable and the data from the table can be copied to spreadsheet or tuning software.