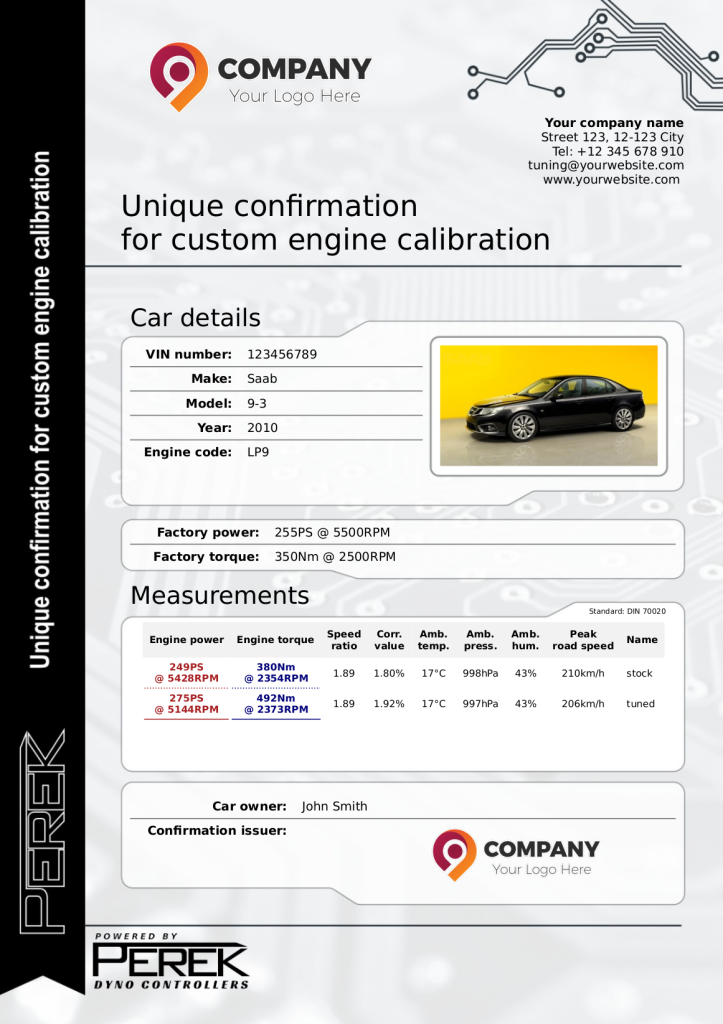
Dyno2 measurement reports can be customized with use of HTML style template file.
The report templates are editable via dyno software in SETTINGS / Report editor. The software from the start contains 3 templates, each in two orientations: portrait and landscape. You can add your own templates and edit the ones that are available from start.
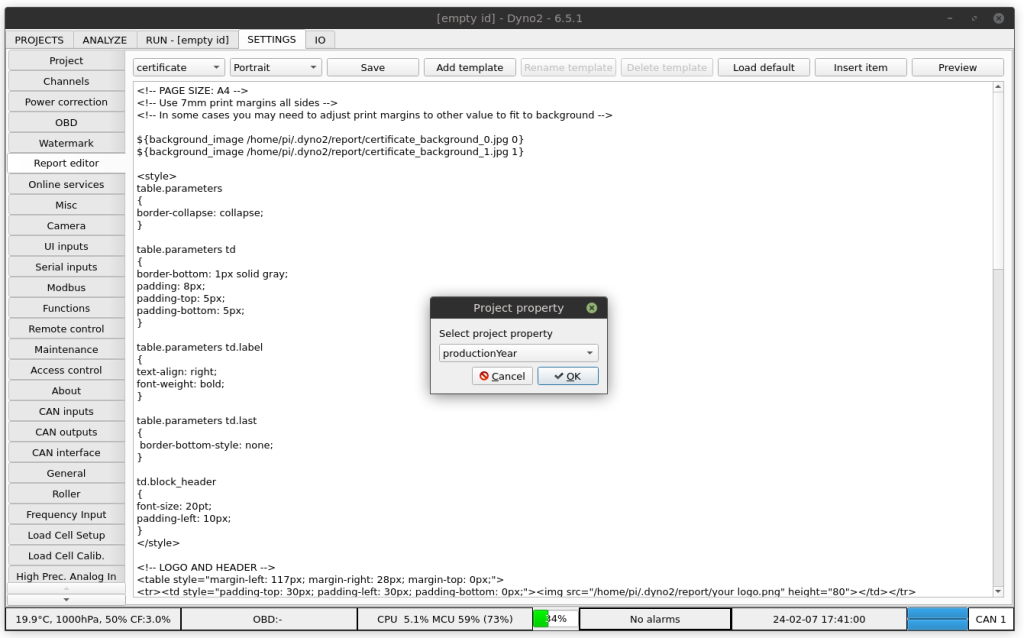
The report editor helps you with inserting project and run properties via Insert item button. It will also help to insert other elements such as graphs, page breaks and images.
File syntax is a mix of common HTML and CSS language with custom commands that will insert dyno specific information into the report. Information about supported subset of HTML and CSS is available here:
The example template file looks like this:
<table><tr>
<td>
<img src="/home/pi/Desktop/your-logo.png" width=300>
</td>
<td align=right>
<b>Your company name</b><br>
Company address<br>
Tel: +12 345 678 910<br>
tuning@yourwebsite.com<br>
www.yourwebsite.com
</td>
</tr></table>
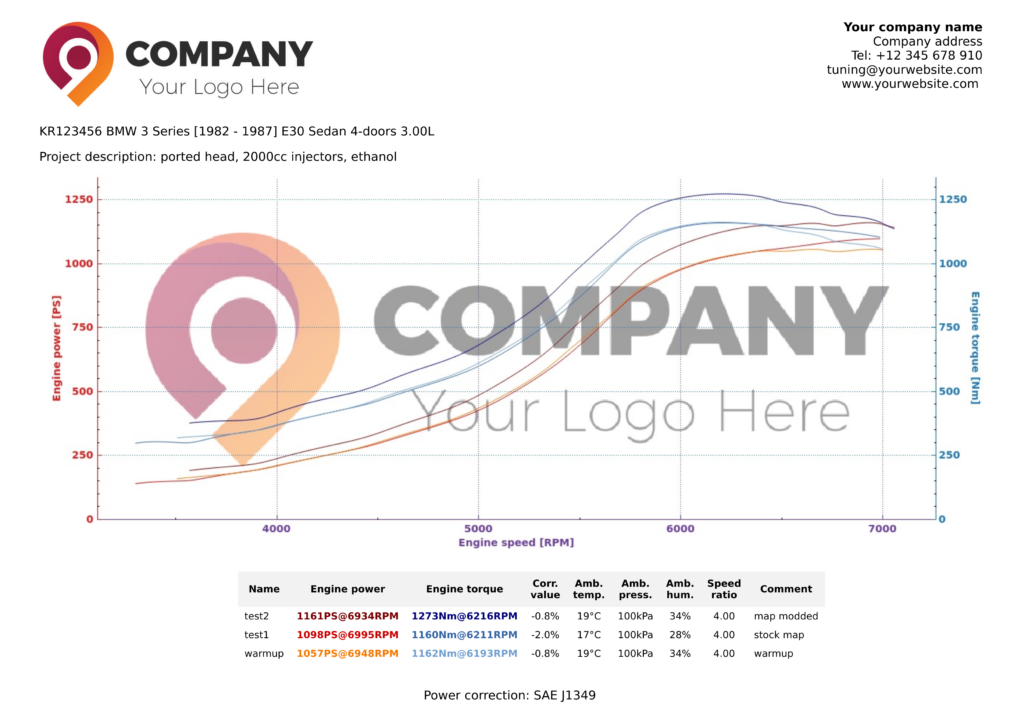
<p>${project_info 0 vehicleId} ${project_info 0 brand} ${project_info 0 model} ${project_info 0 series} ${project_info 0 displacement}</p>
<p>${project_info 0 description}</p>
${main_graph 190,100 120}
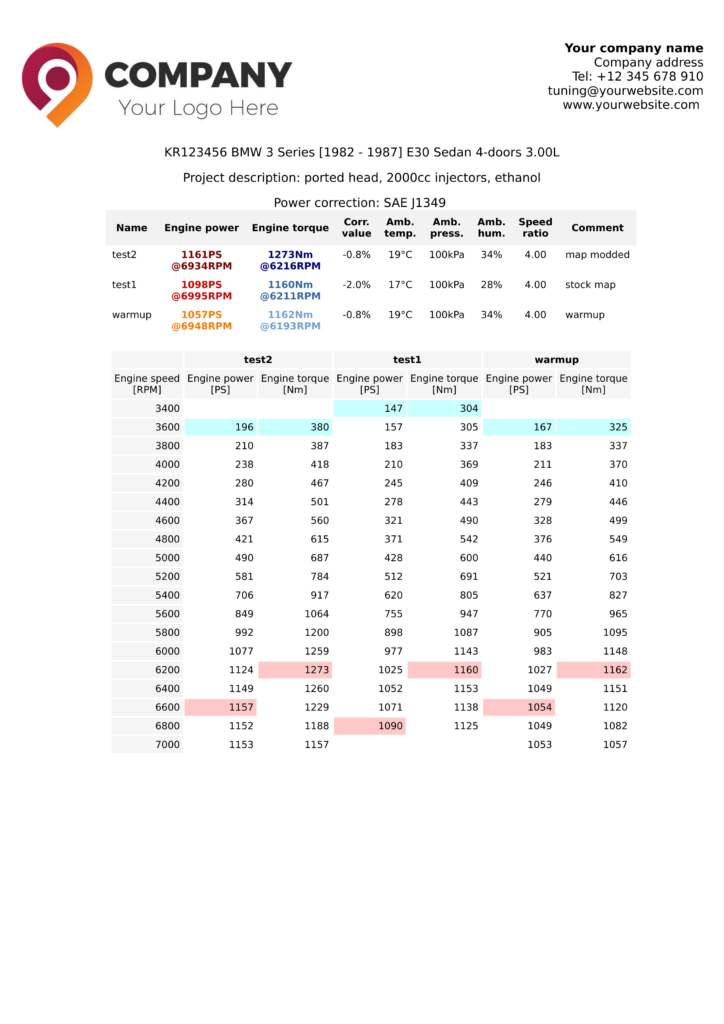
${run_table}
<br>
<p align=center>Power correction: ${run_info 0 enginePowerCorrectionStandard}</p>
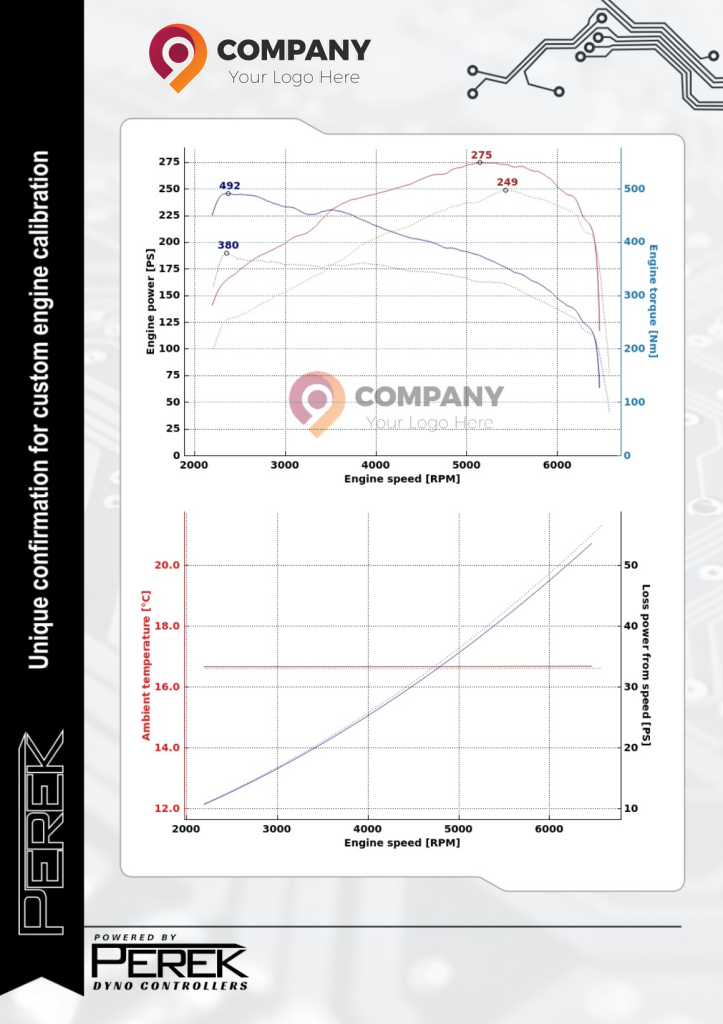
${page_break}
${user_graph 190,200 120}HTML syntax can be learned here: https://www.w3schools.com/html/
Custom dyno information is inserted into the file with use of commands. An example command looks like this:
${main_graph 160,100 96}${ – start of command
main_graph – command name
600,450 – first argument – in this case it is main graph size
96 – second argument – in this case it is main graph dpi
} – end of command
While writing your own template, the dyno application doesn’t need to be restarted. The template file is read every time you select Save / Print pdf action.
If syntax errors are present in your file, debug information can be found in /home/pi/.dyno2/debug.txt
Command description
${background path page}
Command sets full page background image. Page numbering starts from 0.
${background_image /home/pi/Desktop/page0_background.jpg 0}
${background_image /home/pi/Desktop/page1_background.jpg 1}
${img path size}
Command inserts image.
path – relative or absolute path to image file. If path contains white-space, it is required to place it in quotes.
size – inserted image dimensions in millimeters. The format is width,height. One of the dimensions can be replaced with *. It will be calculated automatically to keep aspect ratio.
${img ./my_logo.jpg 100,20}
${img "/home/pi/Desktop/my other logo.jpg" *,15}
${project_picture number size}
Command inserts the picture associated with the project.
number – run number. 0 is the first run.
size – inserted image dimensions in millimeters. The format is width,height. One of the dimensions can be replaced with *. It will be calculated automatically to keep aspect ratio.
${project_picture 0 *,20}
${project_picture 1 100,20}
${main_graph size dpi printID}
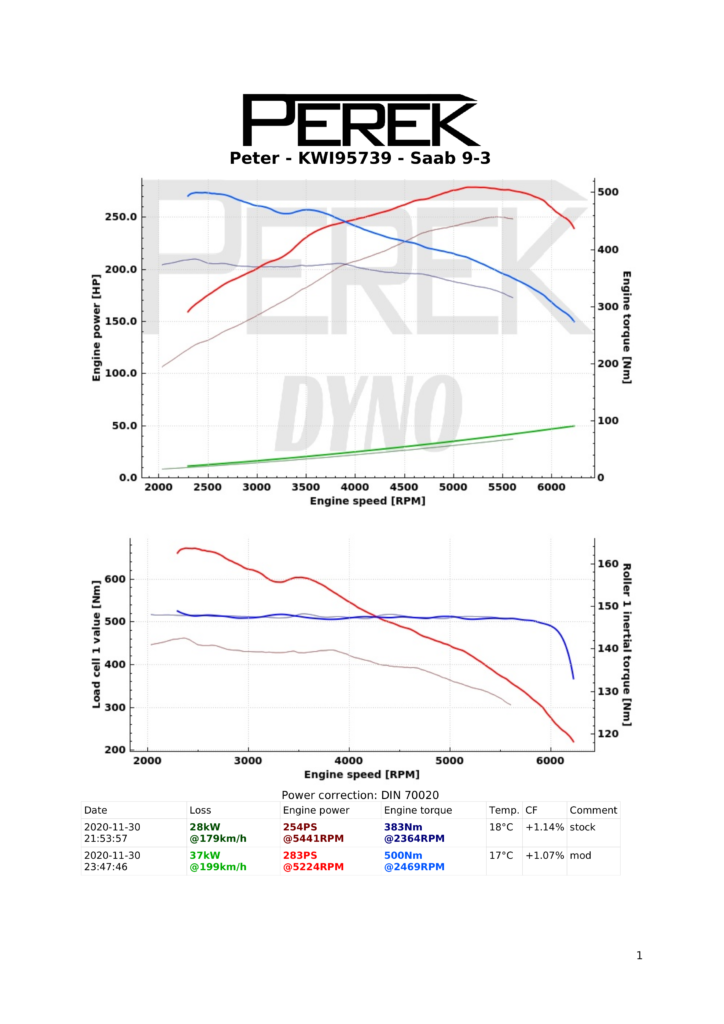
${user_graph size dpi printID}
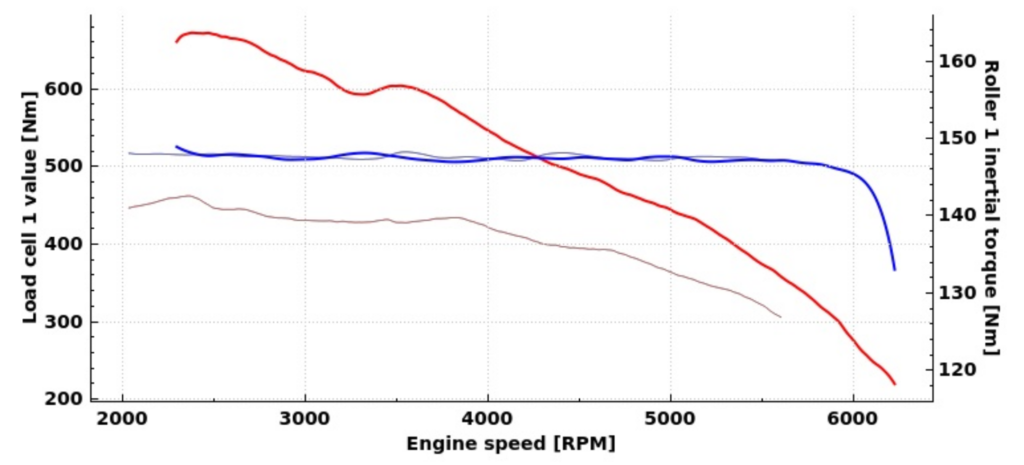
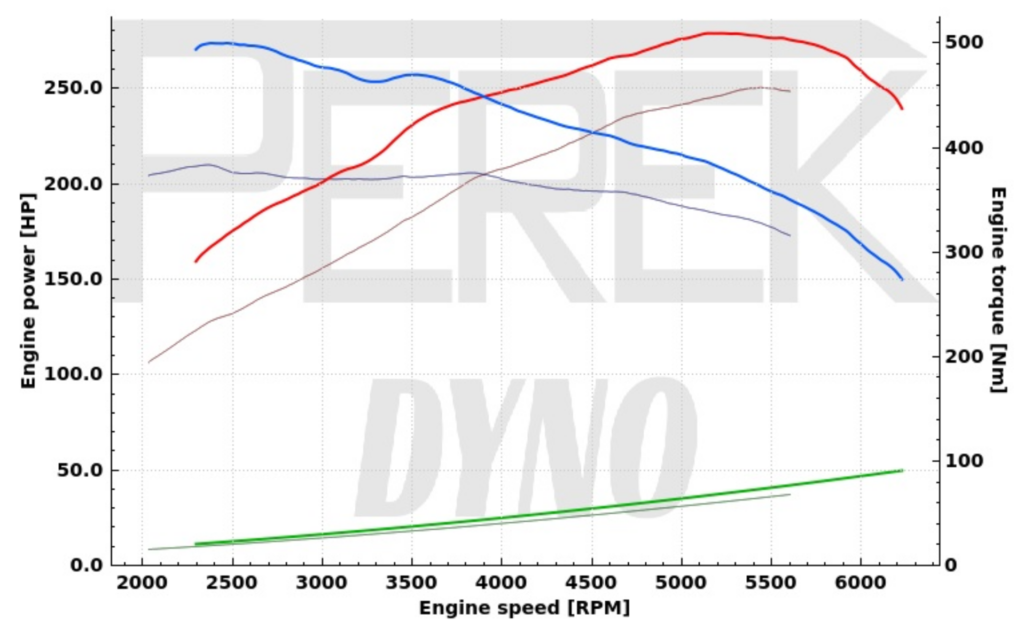
Commands main_graph and user_graph insert graphs from ANALYZE tab.
size – graph size in millimeters. The format is width,height. Dimensions can’t be replaced with * wildcard.
dpi – dots per inch of the graph. The graph elements like lines and text have constant dot size. Increasing dpi will make all graph elements appear smaller. 96dpi will make the printout look like the graph on the monitor. By setting 150dpi you will make the graph illegible on the print preview, but the printout will look good, because a printer usually has higher dpi resolution than a screen.
printID – number to select from multiple graphs. Print ID can be set by right-clicking on the graph in ANALYZE tab.
${main_graph 160,100 96}
${user_graph 160,75 150}
${user_graph 160,75 150 1}
${user_graph 160,75 150 2}
${color_map size dpi printID}
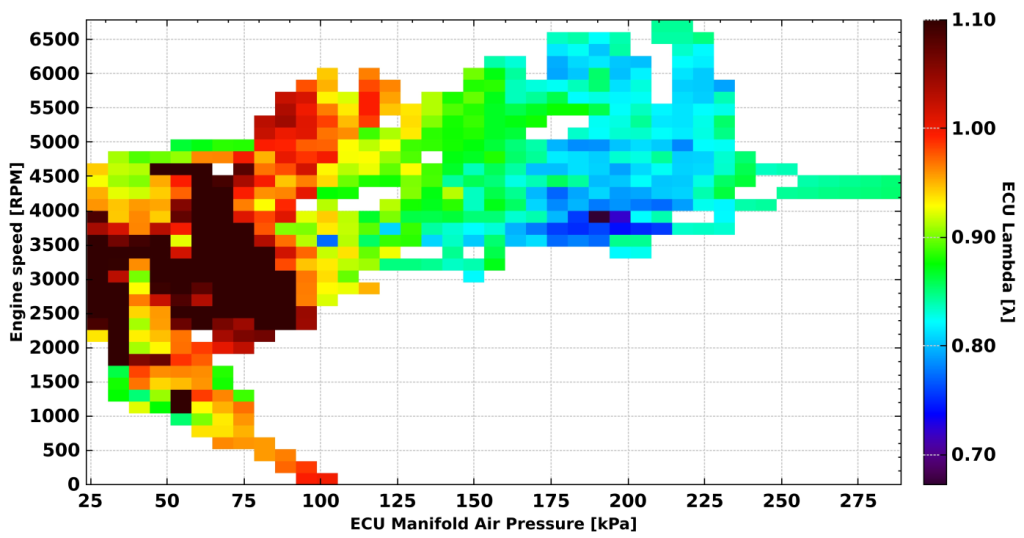
Command inserts the color map from ANALYZE tab.
size – graph size in millimeters. The format is width,height. Dimensions can’t be replaced with * wildcard.
dpi – dots per inch of the graph. The graph elements like lines and text have constant dot size. Increasing dpi will make all graph elements appear smaller. 96dpi will make the printout look like the graph on the monitor. By setting 150dpi you will make the graph illegible on the print preview, but the printout will look good, because a printer usually has higher dpi resolution than a screen.
printID – number to select from multiple color maps. Print ID can be set by right-clicking on the color map in ANALYZE tab.
${color_map 160,100 96 2}${xy_table printID}
Command inserts xy table from ANALYZE tab
printID – number to select from multiple xy tables. Print ID can be set by right-clicking on the xy table in ANALYZE tab.
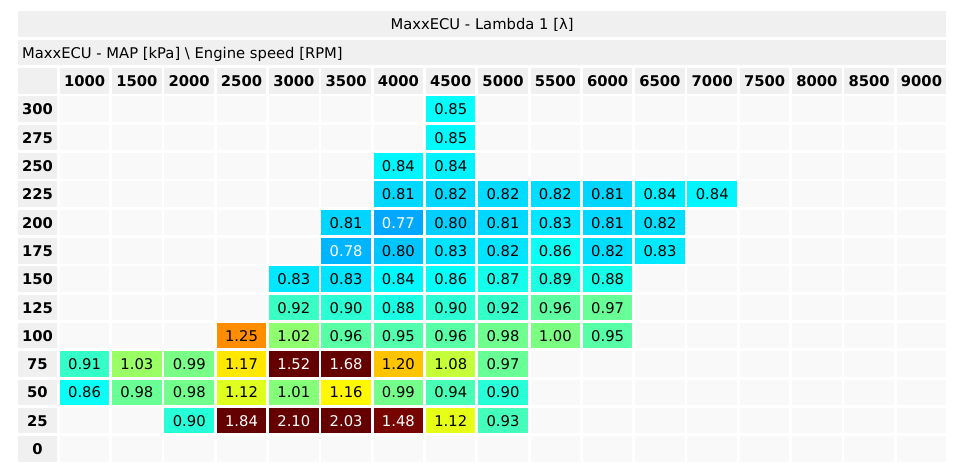
${xy_table 0}${page_break}
Inserts page break. Everything inserted after this command will be on the next printout page.
${run_info number id unitOverride}
Inserts information about run.
Correction standard: ${run_info 0 enginePowerCorrectionStandard}
<br>
<ul>
  <li>${run_info 0 enginePowerCorrectionValue}</li>
  <li>${run_info 1 enginePowerCorrectionValue}</li>
  <li>${run_info 2 enginePowerCorrectionValue}</li>
<ul>
number – run number. 0 is the first run.
id – information id
unitOverride – optionally override the unit
Available information id:
| id | Database entry ID |
| projectId | Parent project database ID |
| filename | Run data filename |
| favourite | Marked favourite |
| creationTimestamp | Creation timestamp |
| modificationTimestamp | Last modification timestamp |
| lastAccessTimestamp | Last access timestamp |
| runLength | Run length |
| engineSpeedSource | Engine speed source |
| engineSpeedRatio | Engine speed ratio |
| enginePowerCorrectionStandard | Engine power correction standard |
| enginePowerCorrectionValue | Engine power correction value |
| ambientTemperature | Ambient temperature |
| ambientPressure | Ambient pressure |
| ambientHumidity | Ambient humidity |
| measuredEnginePower | Peak measured engine power |
| measuredEnginePowerRPM | Peak measured engine power engine speed |
| measuredEngineTorque | Peak measured engine torque |
| measuredEngineTorqueRPM | Peak measured engine torque engine speed |
| measuredWheelPower | Peak measured power on wheels |
| measuredWheelPowerRPM | Peak measured power on wheels engine speed |
| peakRoadSpeed | Peak road speed |
| peakEngineSpeed | Peak engine speed |
| comment | Run comment |
| selectionStart | Selection start |
| selectionEnd | Selection end |
| createdWithSoftwareVersion | Software version at file creation |
${project_info number id unitOverride}
Inserts information about project.
Customer name: ${project_info 0 customerName}<br>
Registration number: ${project_info 0 vehicleId}<br>
Project name: ${project_info 0 projectName}<br>
number – run number. 0 is the first run.
id – information id
unitOverride – optionally override the unit
Available information id:
| id | Database entry ID |
| favourite | Marked favourite |
| creationTimestamp | Creation timestamp |
| lastRunTimestamp | Last run timestamp |
| lastAccessTimestamp | Last access timestamp |
| customerName | Customer name |
| runCount | Run count |
| vehicleId | Vehicle registration number, VIN, etc. |
| projectName | Project name |
| vehicleType | Vehicle Type |
| brand | Vehicle Brand |
| model | Vehicle Model |
| series | Vehicle Series |
| productionYear | Production Year |
| mass | Vehicle mass |
| frontalArea | Vehicle frontal area |
| Cx | Aerodynamic drag coefficient |
| driveWheels | Drive wheels |
| wheelbase | Wheelbase |
| frontTrack | Front Track |
| rearTrack | Rear Track |
| engineCode | Engine codename |
| engineFuelType | Engine fuel type |
| engineBoostType | Engine boost type |
| engineConfiguration | Engine cylinder layout configuration |
| displacement | Engine displacement |
| cylinderCount | Cylinder count |
| valveCount | Valve count |
| compressionRatio | Compression ratio |
| cylinderBore | Cylinder bore |
| pistonStroke | Piston stroke |
| gearboxType | Gearbox type |
| gearCount | Gear count |
| engineInertia | Engine-to-clutch elements moment of inertia |
| drivetrainInertia | Vehicle clutch-to-dyno elements moment of inertia |
| stockEnginePower | Peak stock engine power |
| stockEnginePowerRPM | Peak stock power engine speed |
| stockEngineTorque | Peak stock engine torque |
| stockEngineTorqueRPM | Peak stock torque engine speed |
| measuredEnginePower | Peak measured engine power |
| measuredEnginePowerRPM | Peak measured engine power engine speed |
| measuredEngineTorque | Peak measured engine torque |
| measuredEngineTorqueRPM | Peak measured engine torque engine speed |
| measuredWheelPower | Peak measured power on wheels |
| measuredWheelPowerRPM | Peak measured power on wheels engine speed |
| peakRoadSpeed | Peak road speed |
| peakEngineSpeed | Peak engine speed |
| description | Project description |
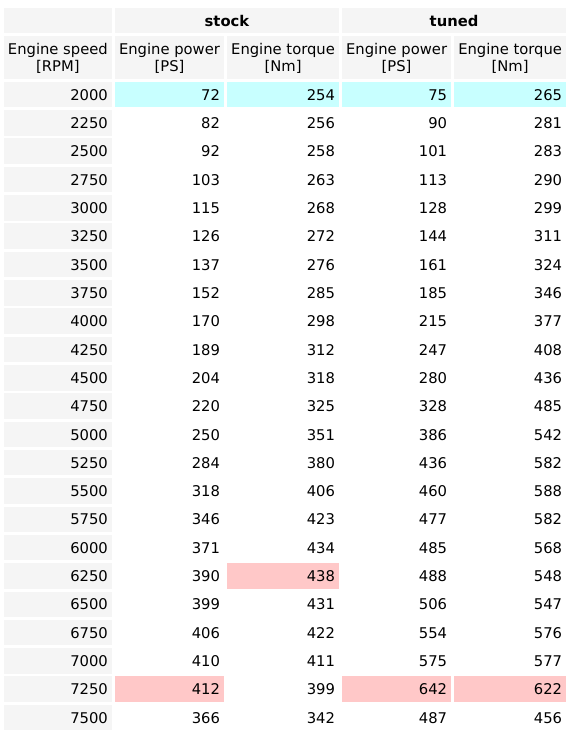
${run_table}
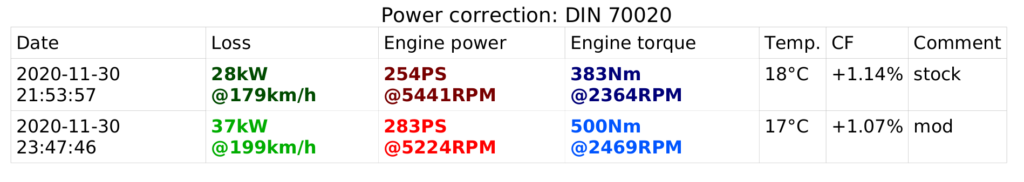
Inserts predefined table with run information. This table contains the same information as the table in ANALYZE tab of the software. To add or remove columns from it, use Hide column and Restore column context menu actions in ANALYZE tab table.
${result_table printID headerRepeat rowRange}
Prints a table with the run data points.
headerRepeat – (optional) the table header will be repeated after a number of rows is printed. Format is N1,N2,N3,… where Nx are the subsequent number of rows before the header is repeated. For example 6,10 will result in first header repeat after 6 rows then another after 10 rows.
rowRange – (optional) range of rows to print firstRow-lastRow.
${result_table 0 6,10 1-30}